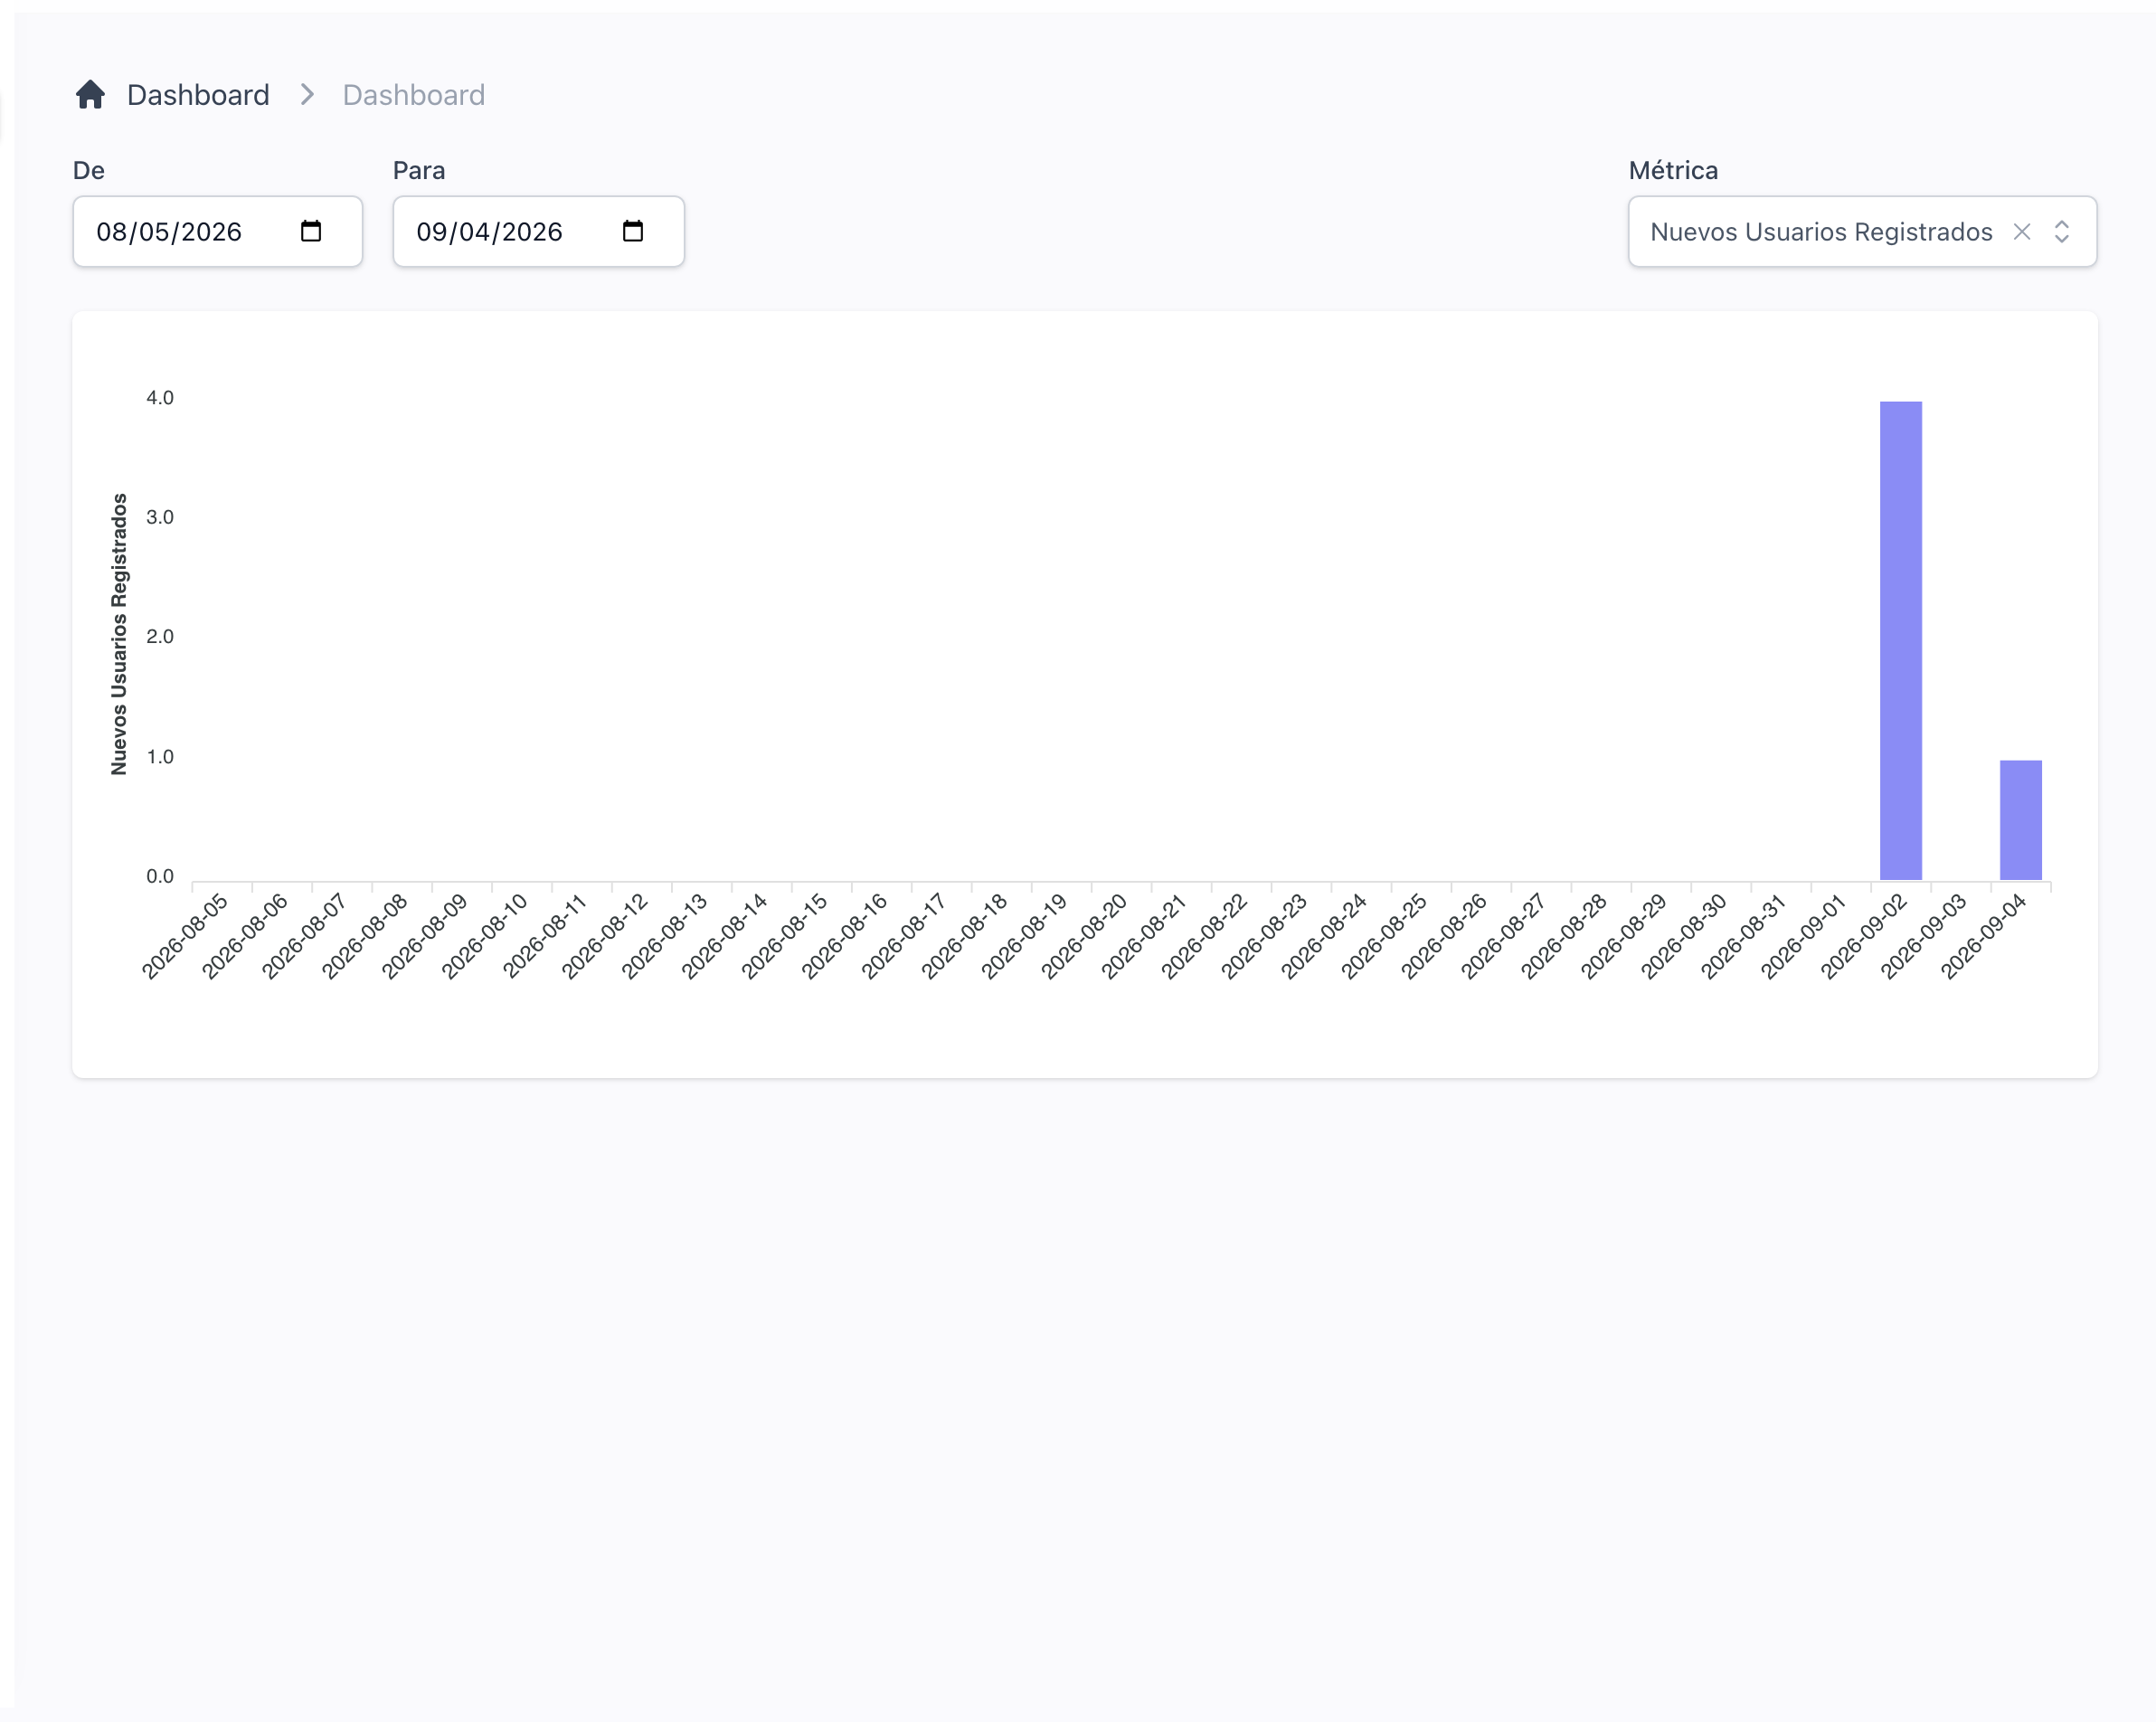
Watch the numbers that matter on the dashboard
Pick a date range and a metric: new users, accumulated users, users signed in each day, users by country, and revenue and subscriptions once billing is on. The chosen chart lives in the URL, so you can bookmark it.