

Dashboard metrics and visitor tracking
What each chart on /admin counts, where its numbers come from, how to add one, and how visitor tracking feeds Facebook.
The admin dashboard draws one chart at a time over a date range you pick. This guide lists every metric it can show and the table each one reads, explains the daily job behind the logged-users count, shows how to add a metric of your own, and covers the optional visitor tracking that records sessions and events and forwards them to the Facebook Conversions API.
The dashboard
/admin is the Livewire component App\Livewire\Admin\Dashboard. It has three controls: From, To and Metric. The range defaults to the last 30 days, ending today; a range typed backwards is swapped, and a date that does not parse falls back to the default. The metric is kept in the URL, so /admin?metric=daily_revenue opens straight on that chart and can be bookmarked; the default new_users is left out of the URL. A metric the URL names but the dashboard does not offer falls back to new_users.
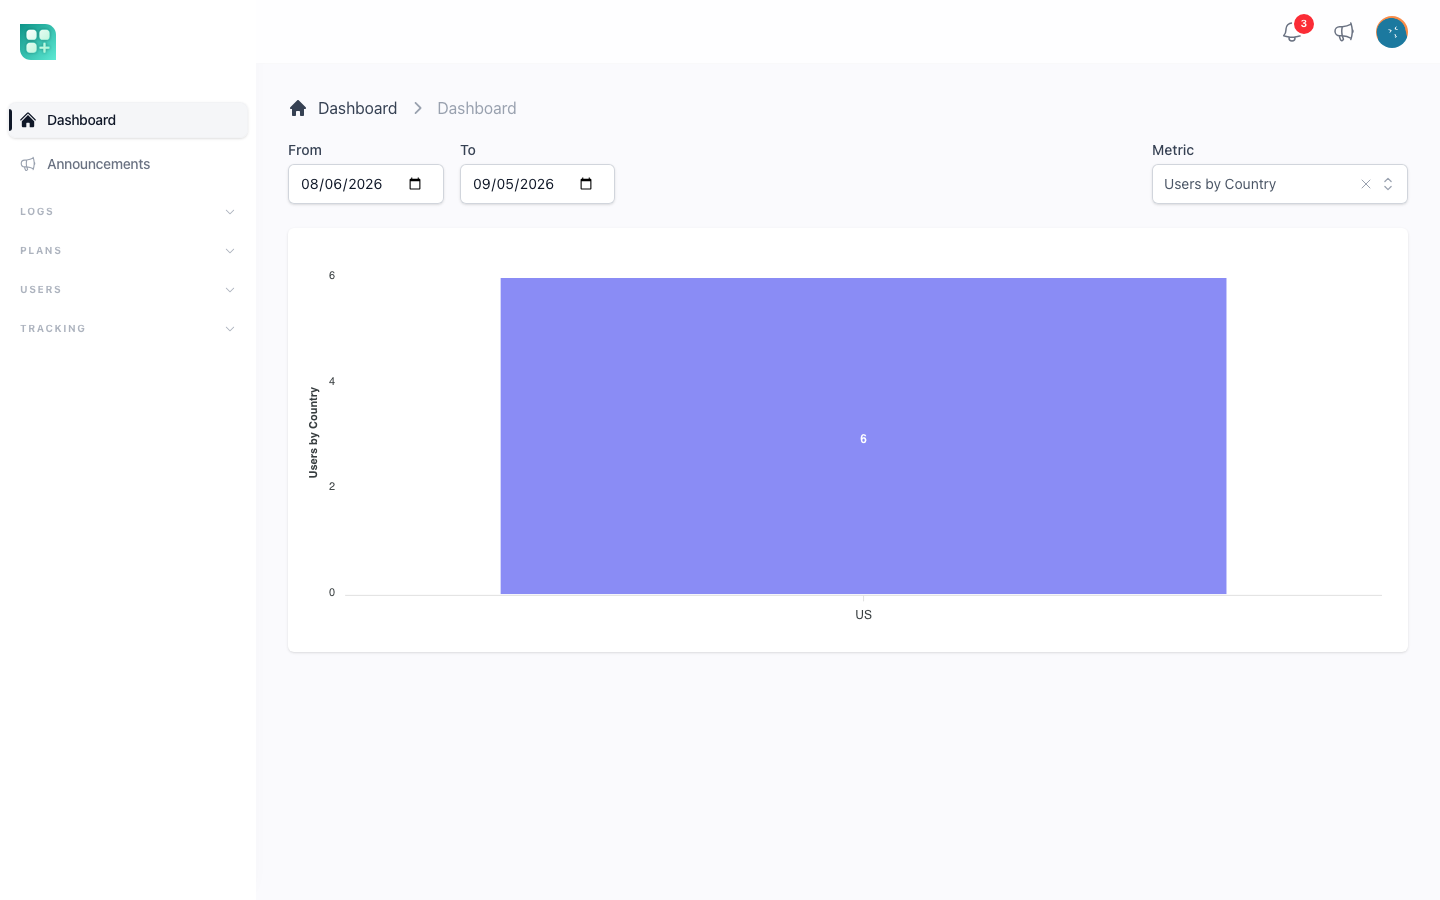
The bars or points of the chart are grouped by the length of the range:
| Range | Bucket | Label |
|---|---|---|
| Under 50 days | One per day | 2026-09-03 |
| Under 6 months | One per week, starting Monday | The Monday's date |
| Under 3 years | One per month | 2026-09 |
| Longer | One per year | 2026 |
The metrics
| Key | Label | Chart | What it counts | Shown when |
|---|---|---|---|---|
new_users |
New Registered Users | Columns | Users by created_at. |
Always |
total_users |
Total Accumulated Users | Line | Users existing at the end of each bucket, starting from the count before From. | Always |
activity_log |
Activity Log Events | Columns | Rows of activity_log by created_at. |
Always |
logged_users |
Daily Logged Users | Columns | The daily_logged_users rows of the stats table, summed per bucket. See below. |
Always |
users_by_country |
Users by Country | One column per country | Every user grouped by country_code, uppercased; accounts with none are Unknown. Ignores the date range. |
Always |
tracking_events |
Tracking Events | Lines: all events, plus one per event type | Rows of tracking_events by created_at. |
FEATURE_TRACKING_ENABLED=true |
referral_subscriptions |
Referral Subscriptions | Two column series | Referrals by registered_at, and referral rewards of type subscription by created_at. |
FEATURE_REFERRALS_ENABLED=true |
daily_revenue |
Daily Revenue (currency) | Stacked columns: Plans, Add-ons, Meters | Every payment the billing tables recorded — subscription invoices, one-off purchases and closed meter periods — converted to the primary currency and stacked by where it came from. | The billing package is installed |
new_subscriptions |
Subscriptions Created | Lines: all paid subscriptions, plus one per plan | Subscriptions whose price is above zero, by created_at. |
Plans are active |
total_subscriptions |
Total Accumulated Subscriptions | Cumulative lines, same series | The same subscriptions, accumulated. | Plans are active |
"Plans are active" means FEATURE_PLANS_ENABLED=true, a STRIPE_SECRET, and at least one plan in the database.
Daily Revenue answers to one rule: the stacked total of a day is exactly the money collected that day, or the chart says why it is not. Each amount is converted into pricing.primary_currency with the rate stored for its own day, written by the provider named in pricing.exchange_rates.provider. An amount it cannot convert — a currency with no rate for that day, or a payment that never recorded its currency — is left out rather than folded in as zero, because a zero reads like a bad day of sales. So is money filed under an origin the chart does not draw. Both are named in a line beside the chart, and written to the log, so the difference between the bars and the bank is never silent. The webhook rows it reads are described in /help/audit-trails-and-webhook-events, the rates in /help/currencies-intervals-and-exchange-rates.
Charts are built by the trait App\Livewire\Traits\HasCharts on top of asantibanez/livewire-charts. It offers a column chart, a column chart with one column per category, a multi-series column chart, a cumulative line chart, a multi-line chart and a cumulative multi-line chart, all taking the range and the bucket size and filling the buckets nobody wrote to with zero. The billing package reuses the same trait, so its charts look like the kit's.
Daily logged users
This is the one metric that is not computed from a timestamp column when the page loads. Three pieces produce it:
App\Http\Middleware\UpdateLastLoggedAtruns on every web request. On a full-pageGETby a signed-in user (not AJAX, not JSON, not a Livewire update) it callsUser::markLoggedIn(), which writesusers.last_logged_atonce per day: only when the column is empty or holds another date. The write is quiet, so it leaves no activity log row.php artisan stats:compute-daily(App\Console\Commands\ComputeDailyStats) counts the users whoselast_logged_atfalls on yesterday and upserts one row instats: keydaily_logged_users,dateyesterday,valuethe count. The table has a unique index on key and date, so running it twice for the same day updates the row.routes/console.phpschedules that command withdailyAt('00:00'), in the application timezone. It only runs when the scheduler runs, so the server needsphp artisan schedule:runevery minute in its cron. See /help/queues-and-scheduled-work.
A day the scheduler missed shows as zero, and the command always counts yesterday: it cannot be pointed at an older date. The migration 2026_05_05_000001_backfill_daily_logged_users_stats fills the history once, from the activity log: for each day, the number of distinct users who caused an activity row, skipping days that already have a stat.
Add a metric of your own
Everything lives in app/Livewire/Admin/Dashboard.php. The example counts open invoices; replace it with your model.
- Offer it in the selector:
#[Computed]
public function metricOptions()
{
    $options = [
        'new_users' => __('New Registered Users'),
        // ...
        'open_invoices' => __('Open Invoices'),
    ];
- Route it to a builder in
chartModel():
return match ($this->metric) {
    'new_users' => $this->newUsersChart($from, $to, $granularity),
    // ...
    'open_invoices' => $this->openInvoicesChart($from, $to, $granularity),
    default => $this->newUsersChart($from, $to, $granularity),
};
- Write the builder. Group the rows with
chartBucketKey()so they land in the same buckets the chart draws, then hand the collection to one of the trait's builders:
private function openInvoicesChart(Carbon $from, Carbon $to, string $granularity)
{
    $data = Invoice::where('status', 'open')
        ->whereBetween('created_at', [$from, $to])
        ->get(['created_at'])
        ->groupBy(function ($invoice) use ($granularity) {
            return $this->chartBucketKey($invoice->created_at, $granularity);
        })
        ->map(function ($invoices) {
            return $invoices->count();
        });

    return $this->buildColumnChart($from, $to, $data, __('Open Invoices'), $granularity);
}
- If it is a line chart, add its key to
isLineChart(); the view picks the line or the column component from that.
The label goes through __(), so add it to lang/en.json and lang/es.json. See /help/languages-and-translations. Wrap the option in a condition when the metric belongs to a feature flag, as the tracking and referral metrics do.
Visitor tracking
Tracking is off by default. It is one flag:
| Env variable | Default | What turns on |
|---|---|---|
FEATURE_TRACKING_ENABLED |
false |
Sessions are opened for visitors, trackingEvent() records events, the three Tracking screens appear in the admin panel and Tracking Events appears in the dashboard. |
The variable is not in .env.example; add the line yourself. With the flag off, the middleware passes requests through, the helper returns without doing anything, and the tracking policies deny every screen.
Sessions
App\Http\Middleware\TrackingMiddleware runs on every web request. On a full-page GET (not AJAX, not JSON, not a Livewire update) it resolves a tracking session when the visitor has none yet, or again when the URL carries fbclid or utm_campaign, so a return through a new campaign link is attributed. TrackingService finds the session in this order: the id kept in the Laravel session under new_tracking_session_id, the cookie of the same name, then any session with the same IP address; failing all three it creates one. The id is written to the session, and to the cookie for 365 days when the session is new.
A session row (tracking_sessions) holds ip_address, user_agent, fbclid, fbp (the _fbp cookie), fbc (the _fbc cookie, or built from fbclid), referrer_url, current_url, campaign (utm_campaign) and user_id. The attribution fields — fbp, fbc, fbclid, referrer_url, campaign — are written the first time they arrive and never overwritten. user_id is filled when a signed-in visitor is seen and the session has none.
Events
Fire an event from anywhere in the application with the global helper:
trackingEvent('Checkout Started', ['plan' => 'pro', 'amount' => 29]);
The helper is a no-op when the flag is off. Otherwise it takes the current session (the id in the Laravel session, or the signed-in user's first session) and records the event on it; with no session — a queued job, a command — nothing is recorded. A user_id key in the payload attaches that user to the session. The event name is a TrackingEventType, created on first use with the name as its title. A session records each event type once: a second Register Started on the same session is ignored.
The kit fires four events:
| Event | When | Payload |
|---|---|---|
Register Started |
The registration page opens. | — |
Register Completed |
A user is created. | user_id |
Subscribed |
A user takes a plan or changes it. | user_id, variation_id |
Subscription Paid |
Stripe confirms a subscription invoice. Recorded on the user's session, creating one when the user has none. | invoice_id, subscription_id, amount, currency |
Forwarding to Facebook
App\Observers\TrackingEventObserver sends every new event to the Facebook Conversions API, inside the same request that recorded it, through TrackingService::sendToFacebook():
| Env variable | Config key | What it does |
|---|---|---|
FACEBOOK_ACCESS_TOKEN |
services.facebook.access_token |
The system-user token of the Conversions API. |
FACEBOOK_PIXEL_ID |
services.facebook.pixel_id |
The pixel the events are posted to, at graph.facebook.com/v18.0/{pixel}/events. |
FACEBOOK_TEST_EVENT_CODE |
services.facebook.test_event_code |
Optional. When set, every post carries test_event_code, so the events show in the Test Events tab of the Events Manager instead of in production. |
Without the token and the pixel id the events are stored and nothing is sent. Each post carries the event type name as event_name, the time, the session's current and referrer URLs, action_source website, the payload as custom_data, and user_data with fbc, fbp, IP and user agent, plus the SHA-256 of the user's lower-cased email and name when the session has a user. A failed post is written to the log as a warning and never breaks the request.
The admin screens
Three resources under Tracking in the sidebar, all behind the flag:
| URL | What it shows |
|---|---|
/admin/tracking-event-types |
The event names, with a title and a description you can edit. The dashboard and the event list show the title, so rename here without touching the code that fires the event. A type created without a name takes its title as the name. |
/admin/tracking-sessions |
Index and detail only: user, number of events, IP, campaign, Facebook identifiers, URLs, user agent and the session's events. |
/admin/tracking-events |
Every event with its type, session, user and payload. Filter by type, by date range and by session id. |
Reading them needs the retrieve tracking_event_type, retrieve tracking_session and retrieve tracking_event permissions. See /help/roles-and-permissions.